City of the day — Los Angeles
Los Angeles: Angels/Clippers/Ducks/Chargers
- 2026 so far
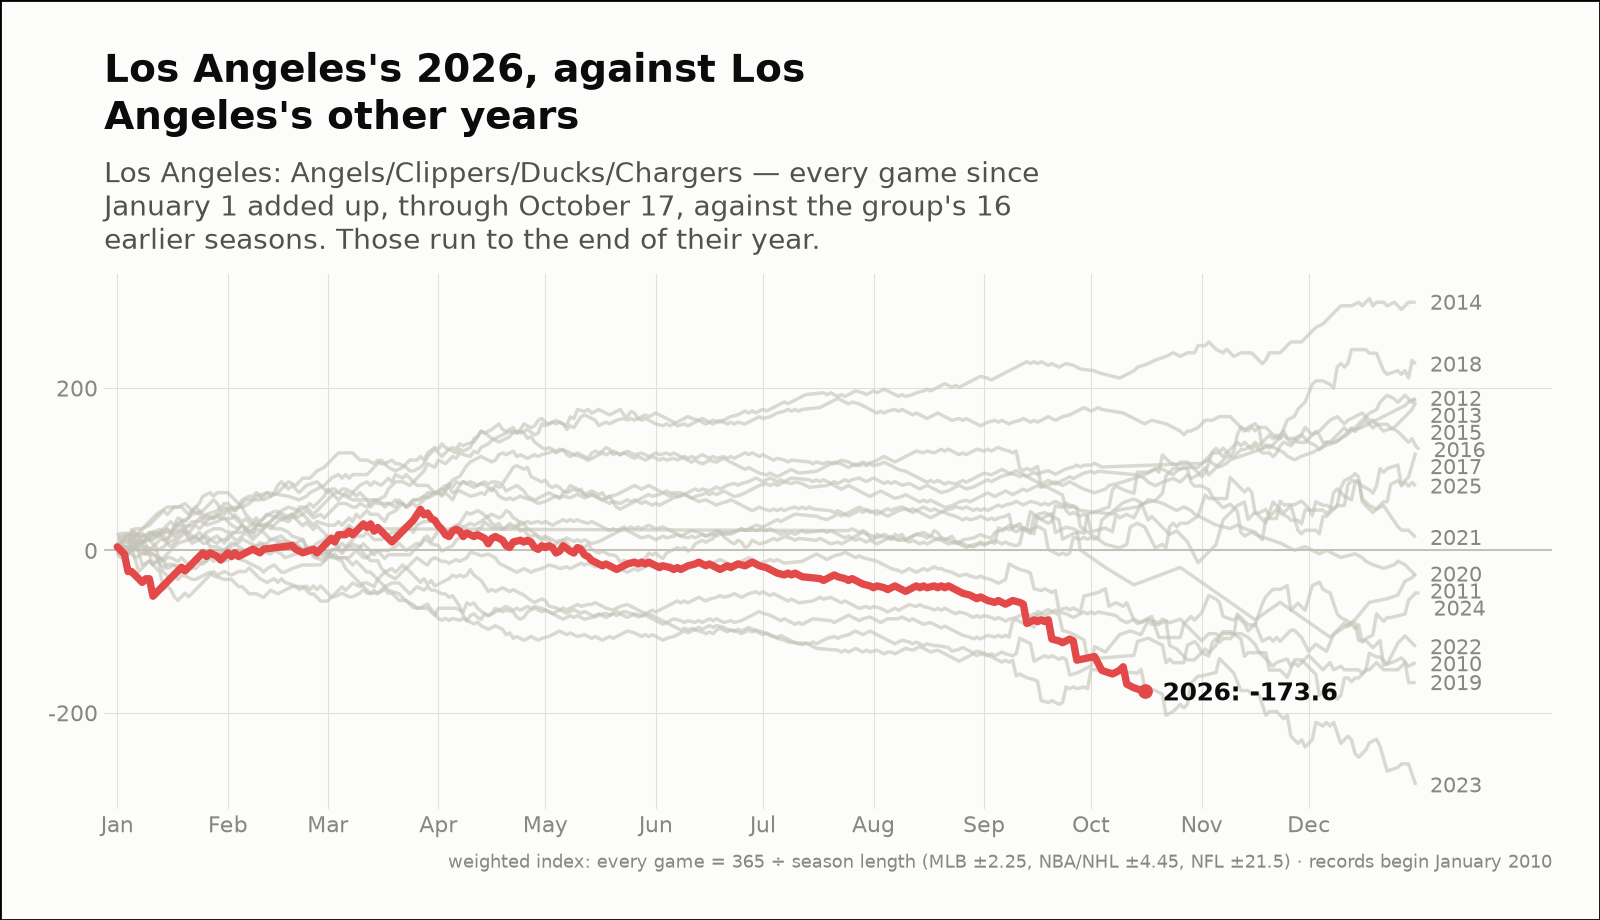
- 125-156, -173.6 weighted over 281 games; longest run 10 straight wins
- Order of results
- about as clumped as coin flips (+0.7)
- Earlier seasons (full-year weighted)
- 2010 -138.0, 2011 -30.9, 2012 +187.4, 2013 +186.8, 2014 +305.8, 2015 +182.7, 2016 +124.2, 2017 +120.8, 2018 +229.6, 2019 -162.7, 2020 -29.0, 2021 +16.0, 2022 -118.5, 2023 -288.7, 2024 -52.3, 2025 +79.4
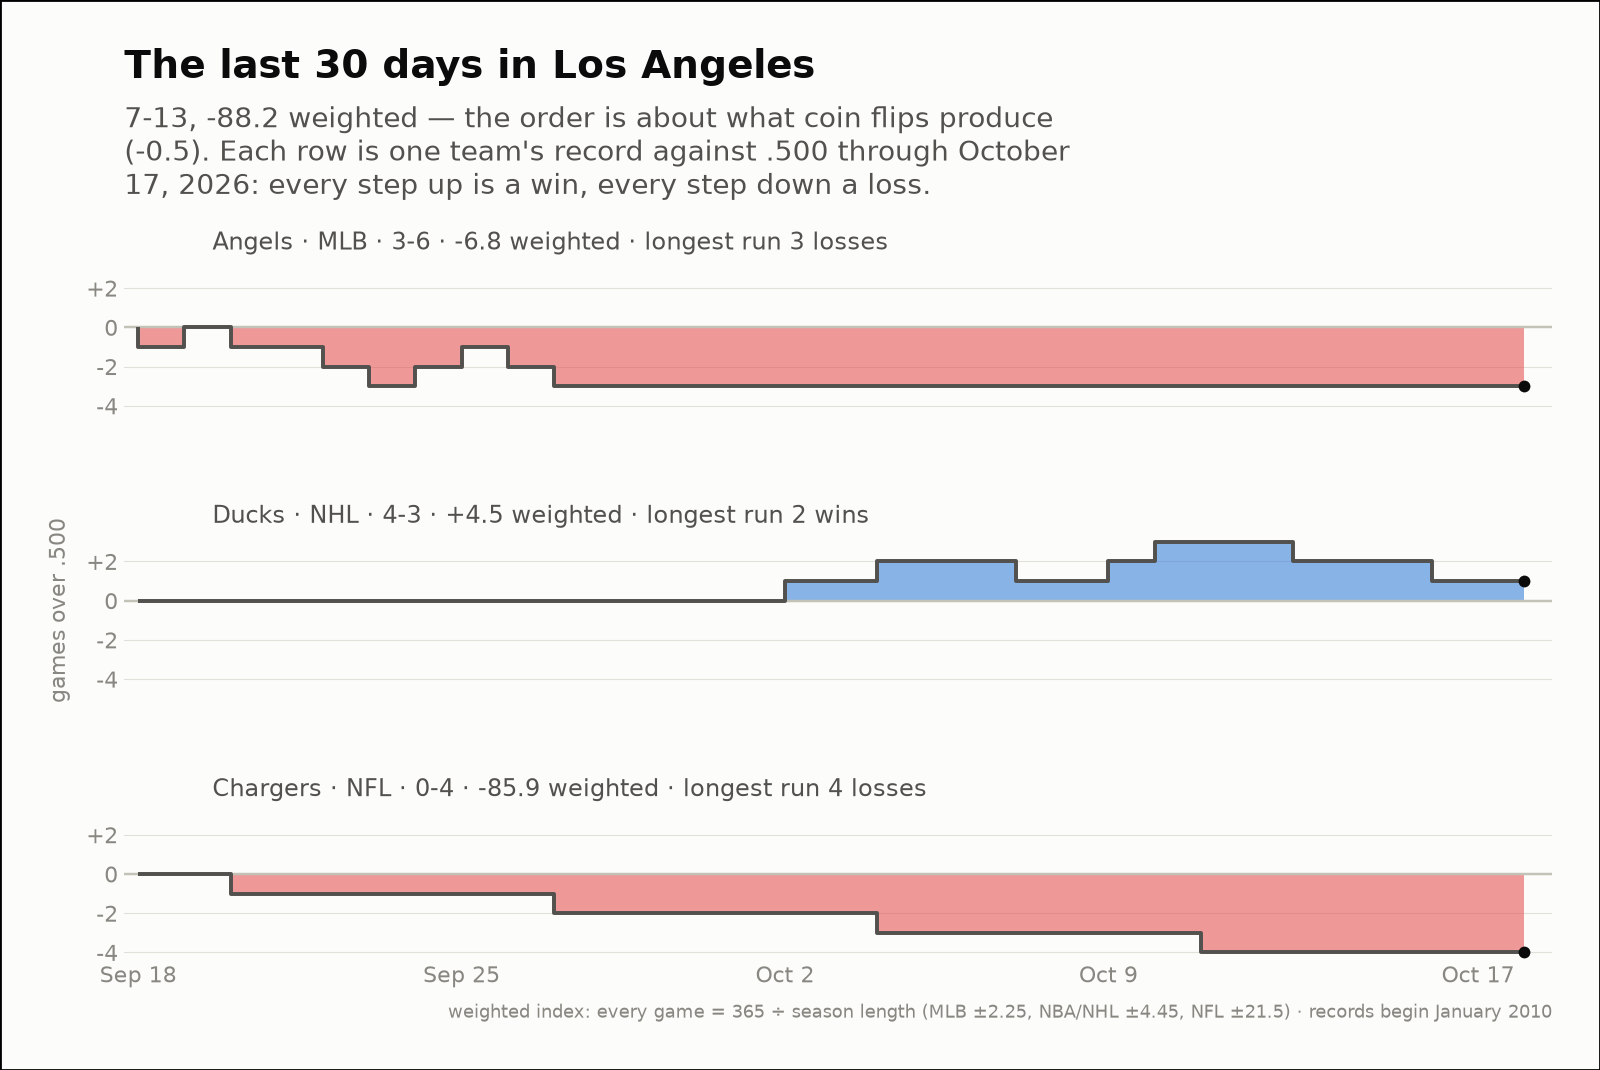
- Last 30 days
- 7-13, -88.2 weighted; longest run 4 straight losses
- Window opens
- September 18, 2026
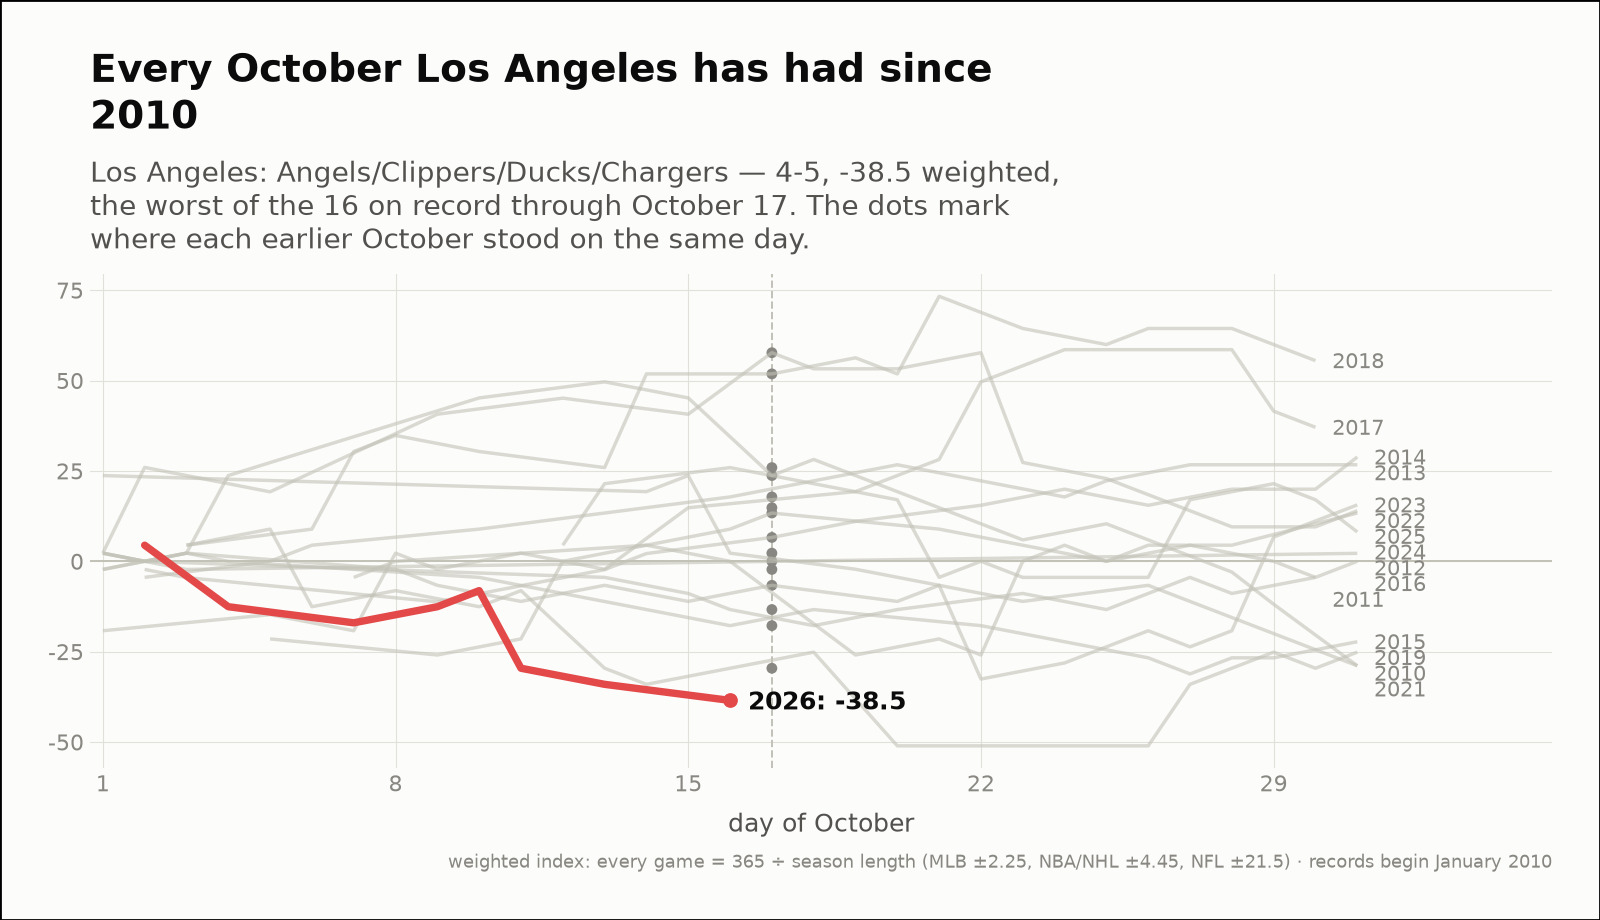
- October 2026 through day 17
- 4-5, -38.5 weighted — the worst of the 16 on record
- Same October in earlier years (same stretch)
- 2010 -6.6, 2011 +13.4, 2012 -2.3, 2013 +17.8, 2014 +6.6, 2015 -17.8, 2016 -13.4, 2017 +14.8, 2018 +51.8, 2019 -29.6, 2021 +23.7, 2022 +57.7, 2023 +2.3, 2024 +25.9, 2025 +0.0
| Team | Last 30 days | Weighted | Longest run |
|---|---|---|---|
| Angels | 3-6 | -6.8 | 3 straight losses |
| Ducks | 4-3 | +4.5 | 2 straight wins |
| Chargers | 0-4 | -85.9 | 4 straight losses |